Table of Contents
Table of Contents
First, click on "File" menu then on "New" item. Then click on "Add state" button. A window will appear, like the one below.
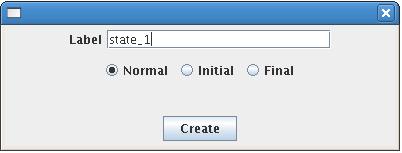
Then, click on "Create" button. A state will appear in the top left corner. Repeat this action twice in order to obtain three states. Then move the states to obtain the same layout as in the following example.
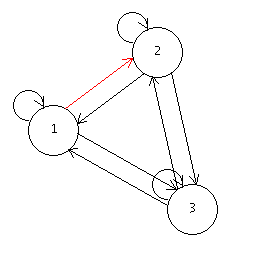
Then, click on "Add transition" button. Click inside the circle figuring state 1, then move to state 2 still holding the left mouse button down. Release the mouse button once inside the circle figuring state 2. An arrow will appear. Simultaneously, a window will appear as in the example below.
Then, click on Ok to confirm your choices. To create a loop, click on "Add transition" button, then just click inside the circle figuring the state concerned. Then, add the other arrows and loops so that the graph is the same as in the example.
To add a mark, click on "Add mark" button. A window will appear as follows.
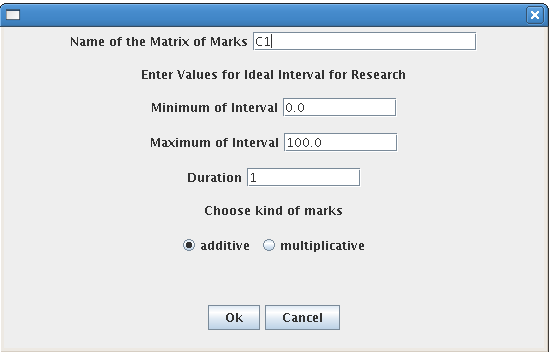
Modify the interval relative to the mark: type in 0.0896 for the minimum and 0.0896 for the maximum. Type in 1 for the duration and click on the "additive" radio button. Click on "Ok". Then, to begin entering the mark's matrix (by default each transition has the value 0), click on transition 1->2. A window will appear as shown below.
Replace value 0 with value 1 and click on "Validate". Repeat this operation for as many transitions as needed. To finish, click again on "Add mark". The mark mention will appear in the "Marks" frame. You can verify that the mark is correct by clicking on the "Display" button.
To launch a computation, first select an additive mark by checking the corresponding check box in the "Marks" frame. Click on "Execute" button. A window will appear as follows.
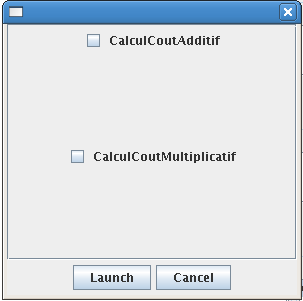
Select "CalculCoutAdditif" and click on "Launch". Then the computation status will appear in the "Current Computation" frame. To see the result, wait for the "Finished" computation status and click on "See Result".
Table of Contents
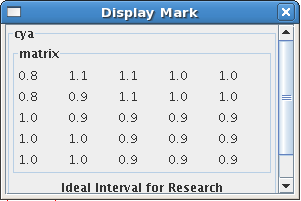
Click on "Add Mark" button, then enter the name "cya". Type in 0.9 for both minimum and maximum. Enter 1 for the duration. Finally, click on the "multiplicative" radio button. Modify the mark on each transition (the default mark is 1.0 for a multiplicative mark) to obtain the following matrix:
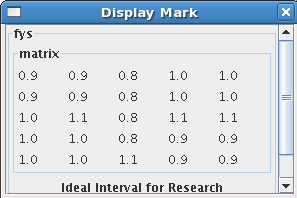
To finish, click again on "Add mark" button. Repeat this step with a new mark named fys. Type 906 for both minimum and maximum. Enter 900 for the duration. Finally, click on the "mulitplicative" radio button. Modify the mark on each transition to obtain the following matrix:
The main use of multiplicative marks is for computing and drawing plots. For this purpose, first choose only the fis mark. To do this, click on the cya mark and click on the checkbox button near the remove button in order to deselect it. Then click on "Computation" menu and then on "Compute graph(s)" item. The computation will appear in the "Current Computation" frame. Wait for the computation to end and click on "See Result". A window will appear as follows,
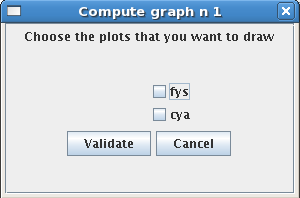
Select all the mark and click on validate button, then you should see a plot like the following one:
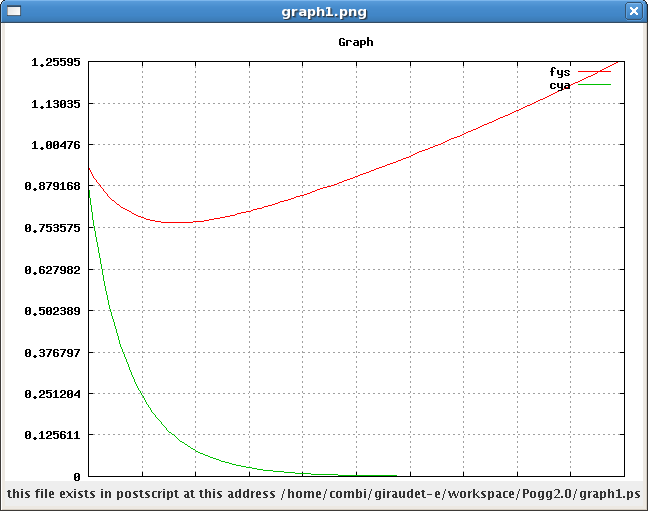
Table of Contents
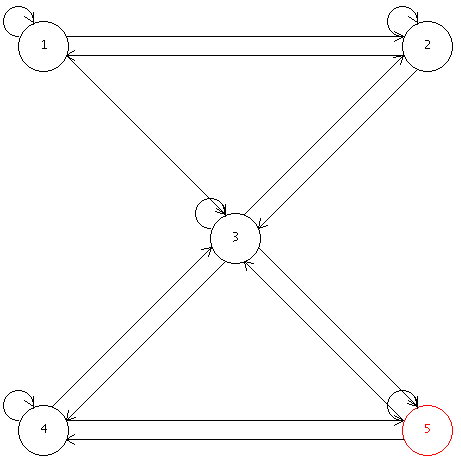
Build a graph like the following one.
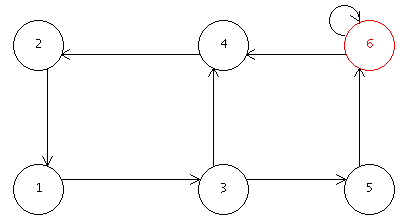
For transitions 1->3, 2->1, 4->2, 5->6, enter interval [100,100] and for the transition 6->4 enter the interval [0,1]. If the transition has already been created, click on this transition and click on "Modify" in the "Graph consultation" frame. Modify the interval accordingly.
Click on "Computation" menu, then on "Request" item and choose the request "Probabilities to access at least once a state". A window will appear as follows.
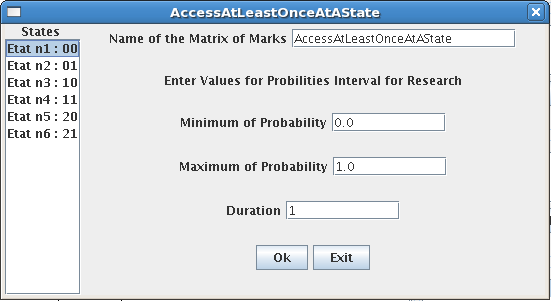
Select state 2 in the top left list. Type in 0.5 and 1.0 respectively for the minimum and the maximum. Enter 100 for duration and click on "Ok". Then, click on "Execute" in the box "Current Computation". A window will appear as below.
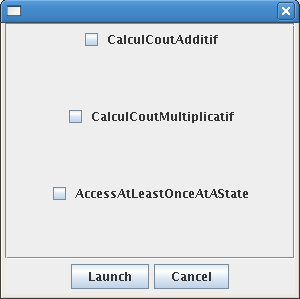
Select "AccessAtLeastOnceAtAState" request and click on "launch". When the computation is finished, click on "See result".